| Optisch experiment met een laserpointer en een CD | |
|
Datum : juli 2002
Principe:
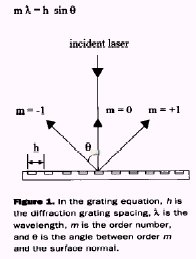
| M.b.v. een laserpointer en een CD is het
mogelijk om een interferentiepatroon te laten zien. Indien men het oppervlak van een CD met een elektronenmicroscoop bekijkt dan wordt bevestigd dat men dit oppervlak kan benaderen als een (niet-ideaal) optisch diffractie rooster. |
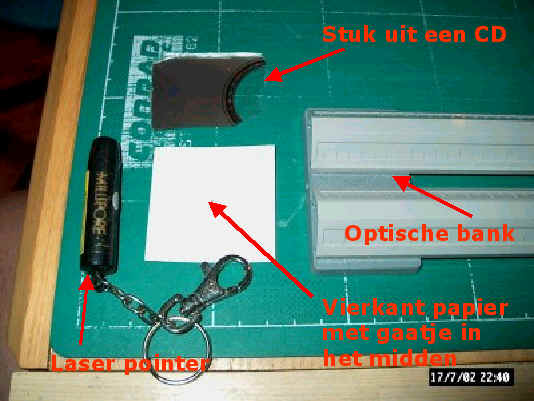
Materiaal:
|
|
Procedure:
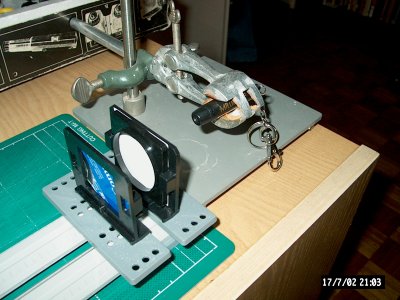
| Bouw de opstelling op zoals schematisch
aangegeven is in onderstaande schets. Hierin is S het papier met het gaatje
erin. De uiteindelijke opstelling kan er dan uit komen te zien zoals in de
foto naast de schets. Het licht van de laserpointer wordt gereflecteerd door de CD en geprojecteerd op scherm S. |
|
  |
|
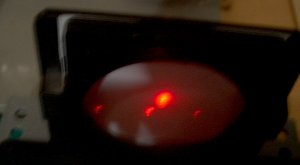
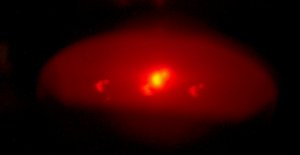
| Indien men de laser inschakelt kan men een diffractie patroon met nul-de en 1ste orde maxima waarnemen op het scherm (zie de resultaatfoto's). | |
Resultaten en discussie:
|
|
Afstand CD <-> scherm = 3.7 cm
Afstand 0-1ste orde = 1.65 cm. Hieruit volgt dat sin(q)
= 1.65/(SQR(1.65^2+3.7^2)) = 0.41 h = 1 * 650/0.41 * 0.001 = 1.6 µm De putjes op een CD hebben een variabele lengte van 0.9-3.3 µm lang, 0.6 µm breed en 0.12 µm diep. De lengte van de putjes wordt als een code uitgelezen bij het draaien van de CD, daarom moet de lengte tot op 0.05 µm nauwkeurig bepaald zijn. De naast elkaar gelegen tracks functioneren als lijnen in het diffractierooster, waarbij de tracks (en dus de roosterlijnen) ca. 1.6 µm van elkaar liggen. Verschillende golflengtes (kleuren) licht worden onder een andere hoek weerspiegeld aangezien de diffractiehoek afhankelijk is van de golflengte. |
|
|
|
Literatuur:
Relevante websites: |
Opmerkingen:
|
Achtergrondinformatie:
| CDs as diffraction gratings
The data which represents the music is stored on the CD in form of very small pits arranged in a tightly wound spiral track in the silvery surface. The distance between two neighbouring tracks is 1.6 micro-metres which is only several times the wavelength of visible light, thus it is too small to be seen in an ordinary microscope. But this small spacing is responsible for the wonderful colours reflected by a CD which works just as a diffraction grating. |
||||||||||||||||||||||||
 |
||||||||||||||||||||||||
| Consider a small part of a CD (see the sketch)
with light shining perpendicularly down on its surface: So all the grooves are
illuminated by the incoming light wave at the same time. Each groove sends out a
lightwave in all directions, and the outgoing wave is the result of the
superposition of all these individual waves. The light from the left groove in
the sketch lags behind the wave sent out from the right groove, because its path
is longer by the piece l = D sin(alpha). If this path difference equals
one half wavelength (or an odd multiple) the peak of wave A coincides with the
trough of wave B, and the two waves cancel each other. But if l amounts
to one full wavelength (or any multiple), the peaks of the waves from
neighbouring grooves overlap, and one gets a bright light in that direction.
Since the separation of the grooves is the same everywhere on the disk, the
contributions from all grooves assist each other.
This means that we get a strong reflection from the grooved surface only in the direction sin(alpha) = lambda/D (or any multiple of lambda/D). Because this direction depends on the wavelength, it is possible to build spectroscopes with diffraction gratings. For the CD we know that D = 1.6 micro-metres, and we can compute the deflection angles (alpha) for each colour of the (first order) spectrum:
|
||||||||||||||||||||||||
| The accurate measurement of the angle allows to
measure the wavelengths. We note that the angle increases almost linearly with
wavelength. So we may estimate the wavelength of a colour or line simply by
judging its distance to certain known colours, such as the orange Na D line at
590 nm, or the lines of Mercury: 579 and 577 (yellow), 546 (green), 436 (blue),
and 405 (purple).
The "rainbows" you saw from the CD in the sunshine are the first order reflections (one wavelength path difference between neighbouring beams), in the centre there is the zero order image, and the fainter bows further out are the second-order spectra. Could one use CDs in professional spectroscopic instruments? No, not really. One can produce diffraction gratings with straight-line grooves and of much better optical quality using glass or metal as a base. And their inventor Henry A.Rowland in 1880 already produced gratings on precision curved surfaces which allowed to focus the spectra properly. The CD is only designed to be operated with infrared light in your CD player, and the width of the grooves is a substantial fraction of their separation. Thus it does not work too well for the much shorter wavelengths in the blue and purple region. For instance, the very strong lines of ionized calcium (the lines traditionally called H and K) at 393 and 397 nm cannot be seen in a CD spectroscope. |
08-01-2017